
Own the Middle Mile.
Control the Cost.
The middle mile (the movement between distribution centers, consolidation hubs, and carrier injection points) is where the biggest freight savings hide. FlexChain plans, optimizes, and executes this critical segment.
The Problem
Middle Mile Is Invisible, and Expensive
- ✕ Multiple handoffs between facilities with no unified visibility
- ✕ Trucks running partial loads on overlapping routes
- ✕ No data connection between order planning and freight execution
- ✕ Rate negotiations based on estimates, not actual shipment patterns
FlexChain's Approach
Data-Driven Route Architecture
- ✓ Analyze historical shipment patterns to identify consolidation nodes
- ✓ Model multi-stop and milk-run routes against actual freight volume
- ✓ Coordinate hub operations: consolidation, deconsolidation, and cross-dock
- ✓ Execute through our carrier network or integrate with your existing fleet
Capabilities
End-to-End Middle Mile
Route Planning
Algorithmic route design based on your actual shipment data. Identify the hub network and lane structure that minimizes total cost.
Carrier Management
Source, vet, and manage carriers for middle-mile lanes. Spot market or contract, we handle procurement and compliance.
Hub Operations
Coordinate consolidation and deconsolidation at hub facilities. Cross-dock, sort, and re-manifest for final-mile injection.
Load Optimization
Maximize trailer utilization through equipment-based stacking algorithms. Cube, weight, and dimension constraints respected.
Tracking & Visibility
Real-time shipment tracking across middle-mile legs. Unified view from origin pickup through hub operations to destination delivery.
Cost Attribution
Break down total freight cost by lane, carrier, client, and service level. Know exactly where your money goes.
Visualized
Consolidation Route Architecture
FlexChain models multi-stop, hub-and-spoke, and milk-run routes across your actual shipment data to find the optimal middle-mile network.
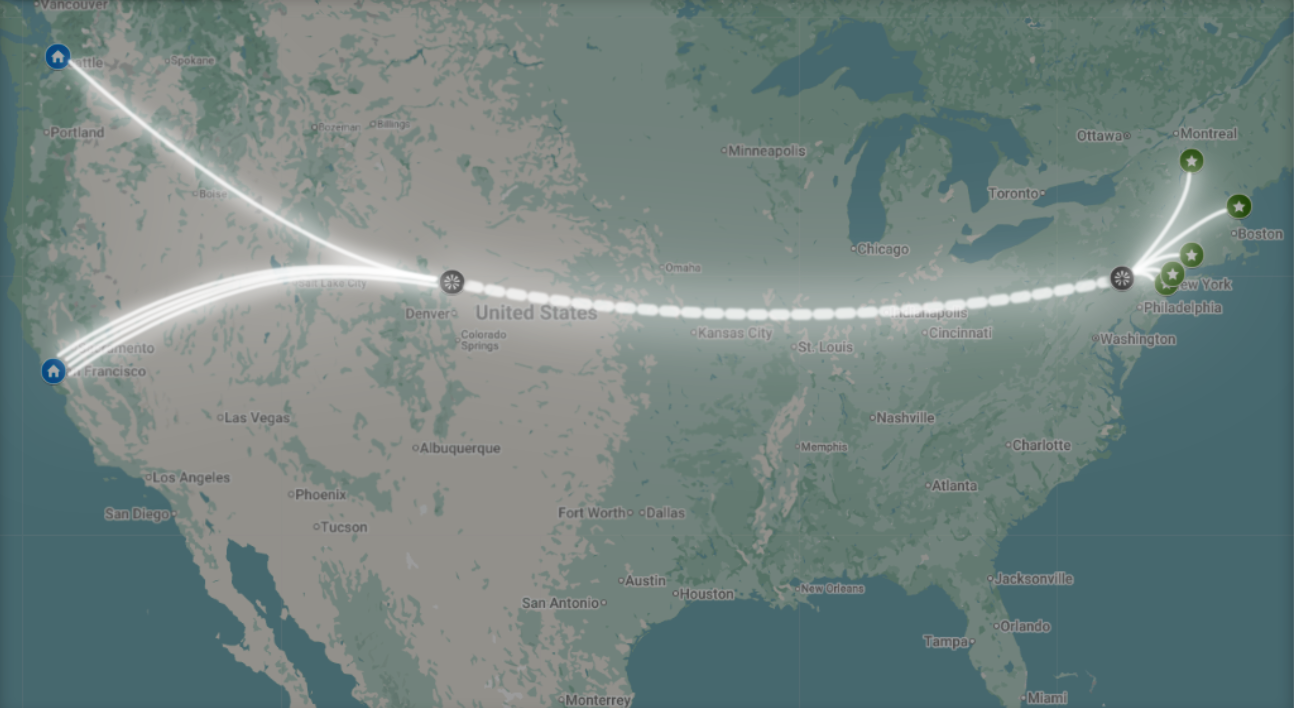
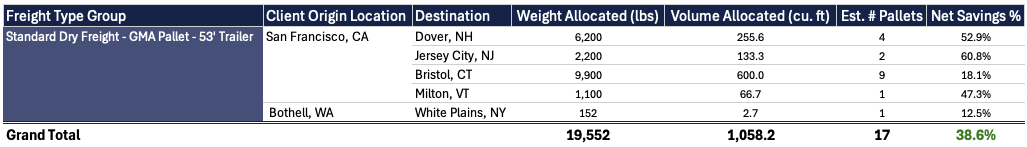
Glow-path route optimization with real savings data, showing 38.6% net savings
Built for:
Ready to Get Started?
Let's start with a conversation about your supply chain.